
GSLIB Help Page: PROBPLT
 Description:
-
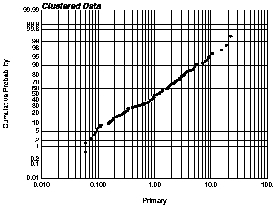
probplt generates either a normal or a lognormal probability
plot. This plot displays all the data values on a chart that
illustrates the general distribution shape and the behavior of the
extreme values. Checking for normality or lognormality is a secondary
issue.
-
Parameters:
-
datafl: the data file in a simplified Geo-EAS format.
-
icolvr and icolwt: column number for the variable and
the weight. If icolwt less than or equal to 0, equal weighting
is considered.
-
tmin and tmax: all values strictly less than tmin
and strictly greater than tmax are ignored.
-
outfl: file for PostScript output.
-
ilog: =0 then an arithmetic scaling of the variable scale
is used, =1 then a logarithmic scaling (base 10) is used.
-
pmin, pmax and pinc: minimum, maximum plotting limits,
and increment for the variable axis.
-
title: a 40-character title for the top of the plot.
A short description of the program