
GSLIB Help Page: QPPLT
 Description:
-
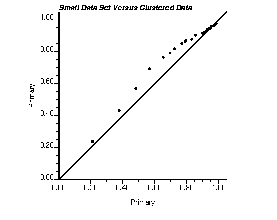
qpplt takes univariate data from two data files and generates
either a Q-Q or a P-P plot. Q-Q plots compare the quantiles of two
data distributions, and P-P plots compare the cumulative probabilities
of two data distributions. These graphical displays are used to
compare two different data distributions, e.g., compare an original
data distribution to a distribution of simulated points.
-
Parameters:
-
datafl1: The data file for the first variable (x axis)
in a simplified Geo-EAS format.
-
ivr1 and iwt1: column number for the variable and the
weight. If iwt1 less than or equal to 0, equal weighting is
considered.
-
datafl2: The data file for the second variable (y axis)
in a simplified Geo-EAS format. Note: It is possible that
datafl2 is the same as datafl1
-
ivr2 and iwt2: column number for the variable and the
weight. If iwt2 less than or equal to 0,
equal weighting is considered.
-
tmin and tmax: all values strictly less than tmin
and strictly greater than tmax are ignored.
-
outfl: file for PostScript output.
-
qqorpp: The flag to tell the program whether to construct a Q-Q
plot (qqorpp=0) or a P-P plot (qqorpp=1).
-
npoints: number of points to use on the Q-Q or P-P plot (should
not exceed the smallest number of data in datafl1 /
datafl2
-
xmin and xmax: minimum and maximum limits for x
axis.
-
ymin and ymax: minimum and maximum limits for y
axis.
-
ilog: =0 then an arithmetic scaling of the axes
is used, =1 then a logarithmic scaling (base 10) is used.
Note that the log scaling only applies to the Q-Q plot; the axis for
the P-P plot are between 0 and 1
-
title: a 40-character title for the top of the plot.
A short description of the program